
Why I’d Fire an Amazon PPC Agency: An In-House Amazon PPC Case Study
By Adeel Imrani, founder of BidVentor (14 years selling on Amazon, $30M+ in ad spend managed, 12+ brands and 500+ products).
Quick answer
Moving to in-house Amazon PPC worked for one 8-figure beauty manufacturer because the agency was optimizing for dashboard metrics, not profit. After the brand cut ties and ran ads from SKU-level margin math, synced inventory with campaigns and attacked fees and returns, net profit went from $911,873.13 in 2023 to $1,184,541.48 in 2024, and reached $920,889.60 for January to July 2025. ACOS improved from the 25 to 30% range to about 19%, and Ad ROAS settled in the 5x range. This post walks through what changed, with the screenshots, and the playbook you can copy.
Key takeaways
- The agency chased ACOS targets and visibility. Profit came back when bids were set from contribution per click and SKU-level margin.
- In 2023, one brand (Brand K) produced 66.3% of branded profit. By 2025 YTD, two brands led almost equally, which made the business far less fragile.
- Ads got more efficient, not just smaller: 2025 YTD ACOS ran roughly 18 to 20% with Ad ROAS near 5x, while total sales were far above 2023.
- Inventory, FBA fees, packaging and returns are PPC levers. Most agencies never touch them.
- Organic share is not the goal. Profit is. Paid traffic should pull demand forward only when the math works.
Why I’m sharing this story
I first wrote this case study on Medium. I’m rewriting it here because the question behind it keeps coming up with the sellers I talk to: should you keep paying an agency, or bring Amazon PPC in-house?
I already compared the options in general terms in Amazon ads agency vs automation. This post is the opposite of general. It is one real business, with real Seller Central and Amazon Ads numbers.
A few ground rules. All brand names are anonymized (Brand K, Brand S, Brand M and so on). Every figure comes straight from Seller Central and Amazon Ads. For qualified partners, verification is available under NDA. I only make claims the numbers support.
The situation: growth on paper, fragility underneath
For years, brand owners have been told that hiring an Amazon ads agency is the only way to scale profitably. Outsource to experts, automate, watch the graphs climb. It sounds right.
The problem starts when the experts optimize for metrics that look good on a dashboard instead of your balance sheet.
In 2023, an 8-figure beauty manufacturer found this out the hard way. What began as a stable agency partnership turned into a cycle of rising ad spend, volatile CPCs and flattening margins. In 2024 they made the call to cut ties with the agency and bring strategy back in-house. Net profit rose 29.9%, from $911,873.13 in 2023 to $1,184,541.48 in 2024, ad costs dropped 20%, and organic sales reached record highs.
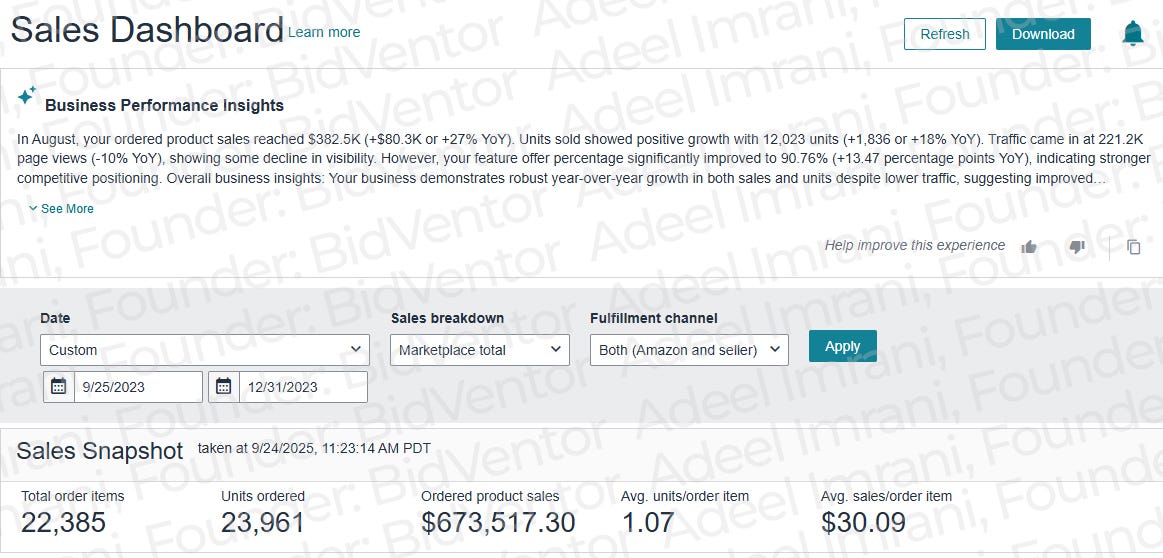
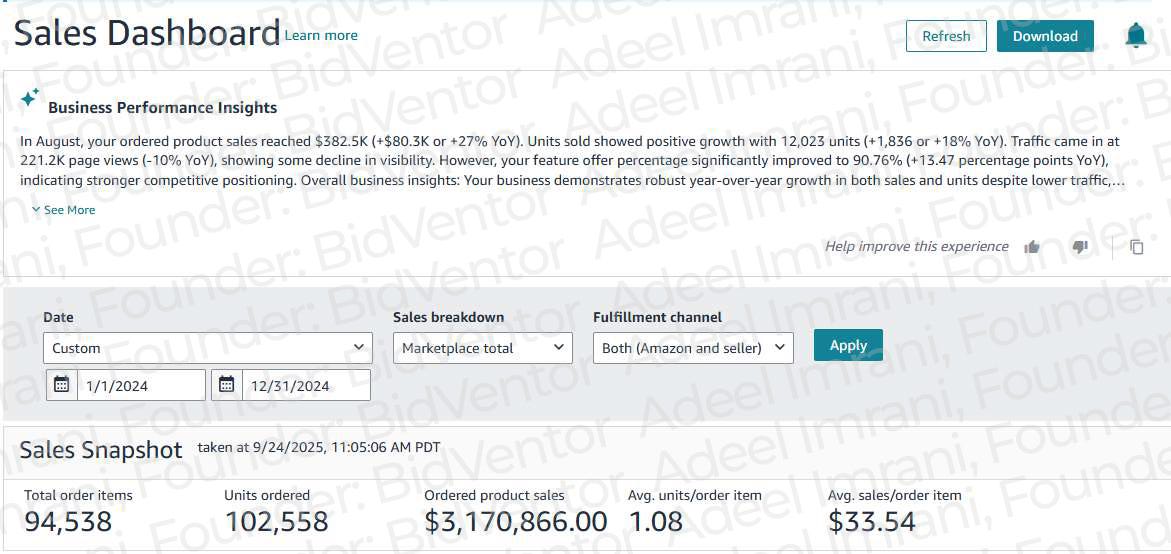
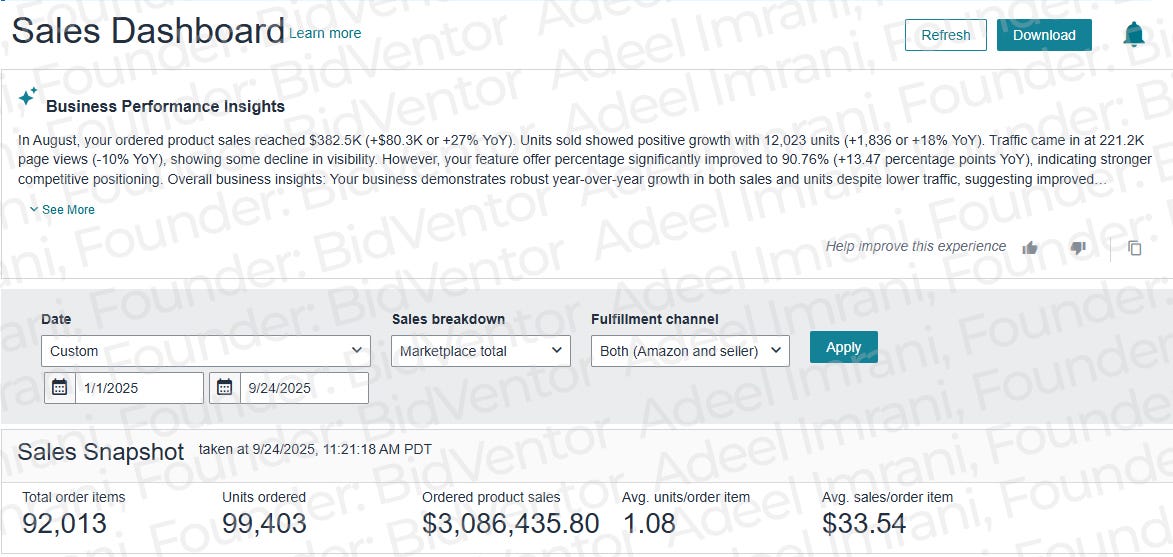
What we measured
To keep this honest, the analysis used three data sets:
- Brand-level net profit by year (2023, 2024, and January to July 2025).
- Monthly P&L by brand: product sales, COGS, shipping, FBA fees, net profit %, and promotions.
- Monthly Amazon Ads data from January 2023 to August 2025: ad spend, ad sales, ACOS, Ad ROAS, impressions, CTR, clicks, orders and units, ad CVR, total sales and total ROAS.
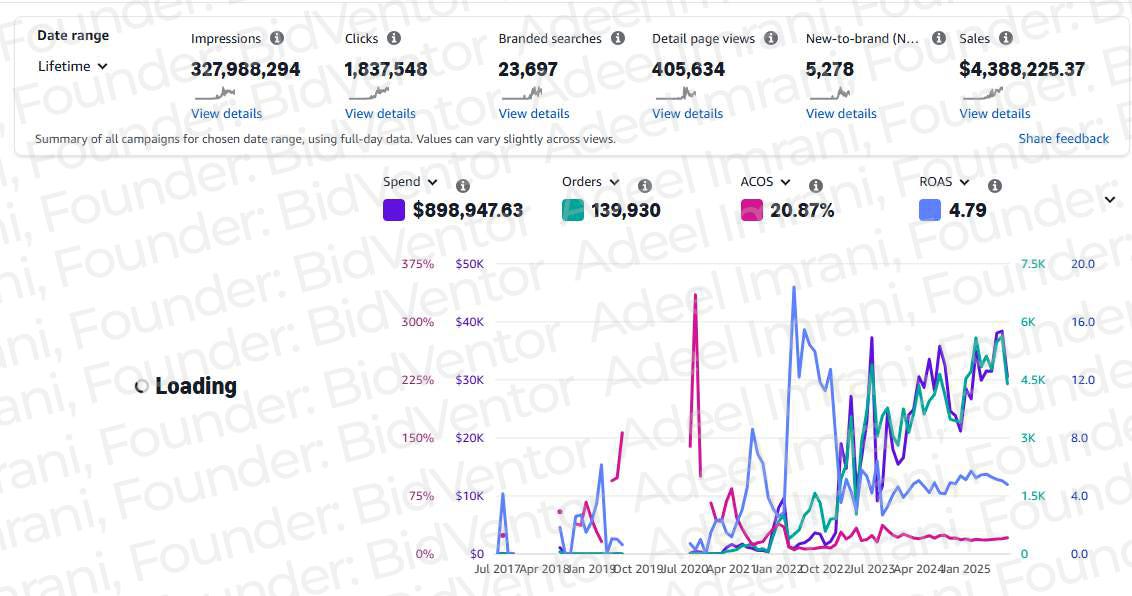
2023: the illusion of control under the agency
On paper, 2023 looked like a good year. Revenue was strong and sponsored ads delivered steady impressions. Inside the P&L, it was a different story.
The agency managed to ACOS targets, not contribution margin. Campaigns chased visibility over value, and in peak months ad spend ballooned while profit wobbled. Three problems stood out.
Concentration risk. Brand K, the flagship haircare line, delivered $604,196.00 of $911,873.13 in total net profit. That is 66.3% of branded profit sitting on one brand. A stumble there would have hit the whole company.
Ad volatility. The account swung hard from month to month:
- ACOS went from 15.62% in August 2023 to 37.20% in September 2023.
- Ad ROAS fell from 6.40x in August to 2.69x in September.
- CTR moved from 0.80% in August to 0.52 to 0.62% in January and July, and CVR whipsawed, with a 2.18% April outlier against a typical 6 to 8%.
Unstable organic share. I calculate organic share as (Total Sales minus Ad Sales) divided by Total Sales. In 2023 it ran all over the place:
| Month (2023) | Total sales | Ad sales | Organic share |
|---|---|---|---|
| April | $193,330.79 | $33,804.10 | 82.5% |
| July | $272,905.35 | $156,328.09 | 42.7% |
| September | $172,997.71 | $102,119.05 | 41.0% |
Q4 recovered to 51 to 54% organic. The lesson: top-line revenue can hide real risk. Profit existed, but it was not resilient.
Late 2023 to mid-2024: stabilize before you scale
By late 2023, leadership decided to move away from the agency model and build its own PPC framework around profit, not spend. The first job was to stop the leaks.
Bid on contribution, not emotion. Each SKU’s bid ceiling came from its contribution per click, replacing blanket ACOS rules. If you want the math, I break it down in how to work out your max CPC on Amazon.
Cut bid waste. We pruned broad and irrelevant terms and consolidated the exact-match winners.
Fix fees and packaging. We audited product dimensions and re-boxed SKUs where we could to avoid FBA fee cliffs. Agencies rarely touch logistics, so these savings had been sitting there for years.
Sync inventory with ads. Stockouts had been quietly inflating ACOS and wrecking rank. Lining up purchase orders with campaign timing stabilized both.
The early signs showed up fast:
- ACOS moved from 25.65% in January 2024 to 19.78% in April 2024, with Ad ROAS at 5.06x.
- Organic share held near 50% in early 2024: 50.2% in January, 50.3% in February and 50.0% in March.
- Blended Total ROAS stayed healthy, around 9x in April.
None of this needed a single new listing. Removing avoidable waste and aligning operations with marketing is the fastest clean profit most brands can find.
August 2024: the inflection point
In August 2024, the team handed over full strategic control of Amazon operations. That is when we started running the account like a system. Four things changed.
- Profit-based bidding instead of ACOS worship. Targets came from contribution per click and SKU-level margin. Guardrails tied to TACOS and rank goals stopped us from winning the auction and losing the P&L. (More on why ACOS alone misleads you in TACoS vs ACoS.)
- CRO-first listings. We tested image sequencing, value-per-ounce messaging and pack sizes. The result was higher average order value without promos and higher conversion without coupons.
- Inventory orchestration. Order timing matched the expected click and conversion curves, so campaigns never ran into rank-killing stockouts.
- Cost control as a growth lever. Fee audits, cartonization and inbound plans all got the same attention as campaigns. If it hits the P&L, it is marketing.
Within weeks, ACOS settled under 20% in key pushes, organic lift started compounding as rank stabilized, and the smaller brands began to matter.
Why the agency had become the bottleneck
Most agencies are built around campaign volume. More campaigns and more spend mean more billable work. At scale, that model works against profit.
After the agency was gone:
- The wild ACOS swings stopped.
- Creative testing was judged on outcomes, not activity.
- Inventory became a marketing lever.
We also started reading Sponsored Products CPC differently. It is less a cost line and more a signal of how crowded an auction is. Managing it actively, instead of reacting late, kept us out of the slow CPC creep that agencies often miss. Even as ad spend came down, total profit went up.
2024 to 2025: the numbers
Here is total sales for the same months, two years apart:
| Month | 2023 | 2025 | Change |
|---|---|---|---|
| January | $137,785.45 | $293,285.20 | +112.9% |
| February | $149,419.32 | $308,114.76 | +106.2% |
| March | $219,915.28 | $355,709.01 | +61.8% |
| April | $193,330.79 | $387,625.47 | +100.6% |
| May | $186,208.75 | $402,627.25 | +116.1% |
| June | $236,241.11 | $340,963.06 | +44.3% |
| July | $272,905.35 | $351,060.36 | +28.6% |
| August | $207,272.33 | $343,225.03 | +65.6% |
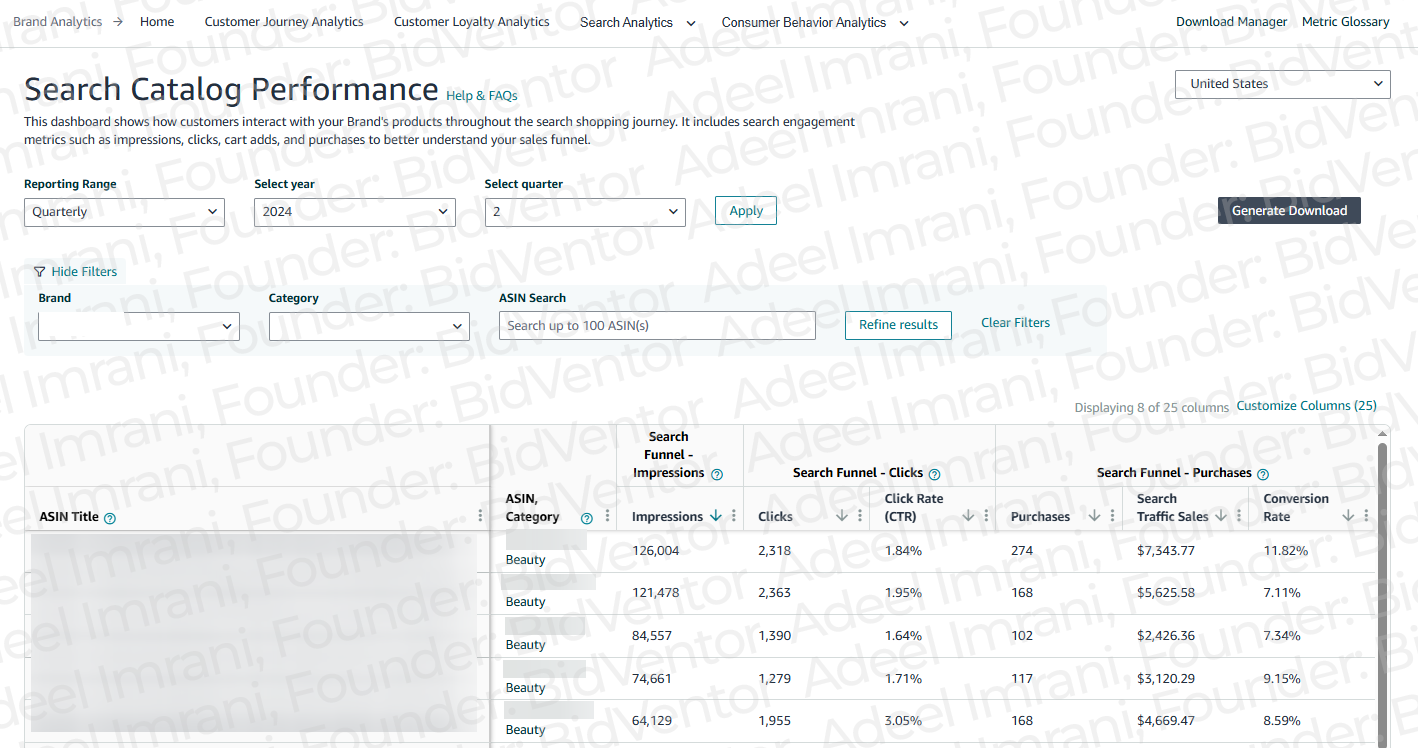
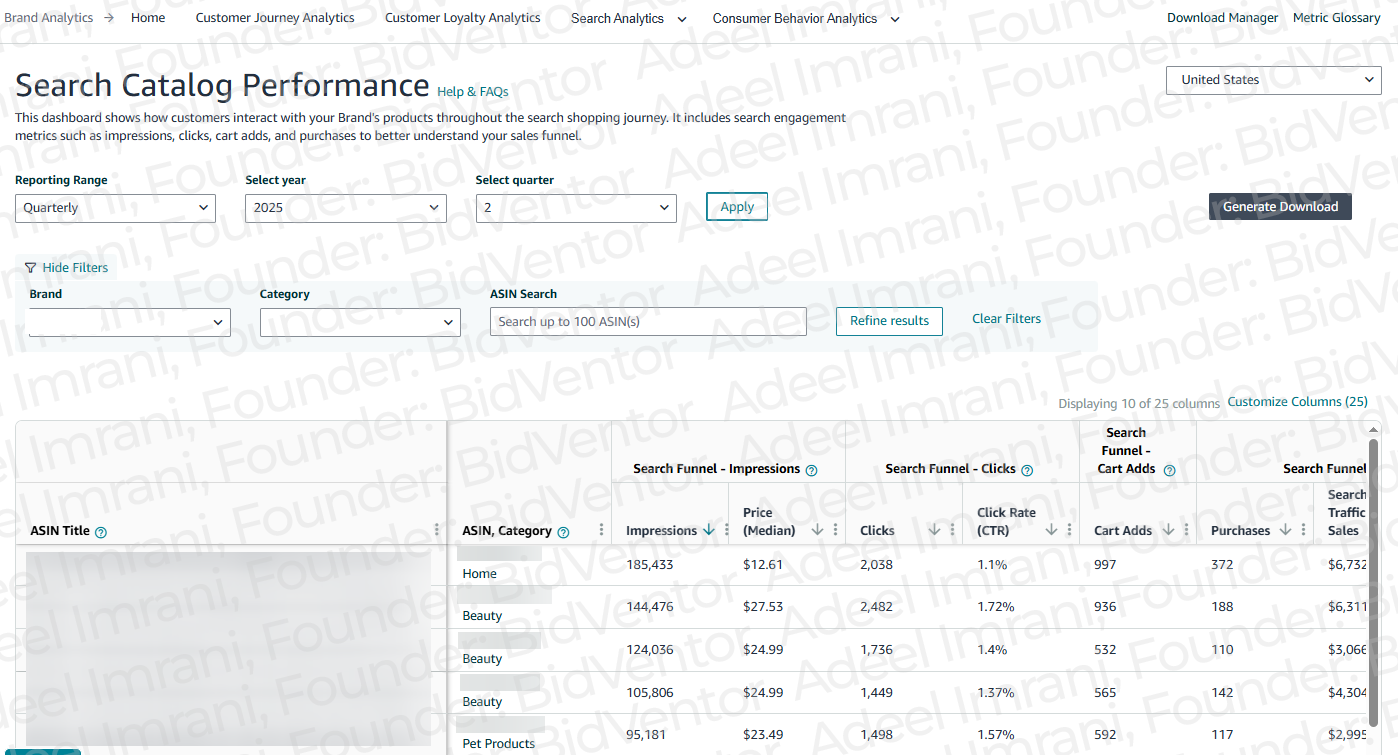
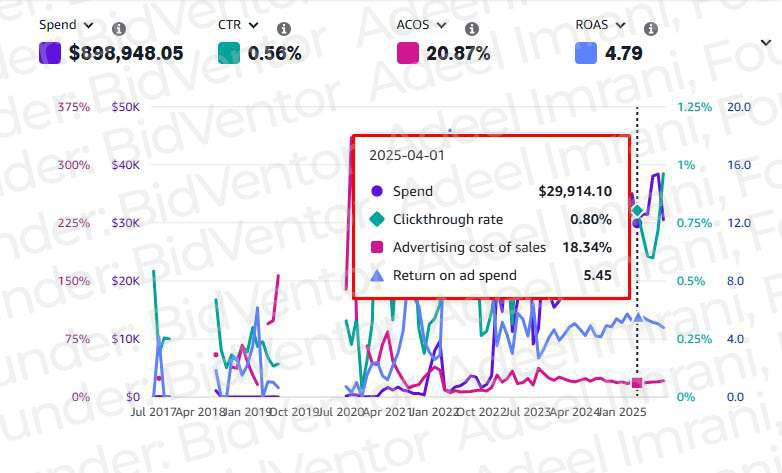
Ad efficiency.
- 2023 ACOS was volatile, hitting 30 to 37% in several months (September 37.20%, October 30.50%).
- 2024 ACOS ran mostly around 20 to 24% (October 20.34%, December 18.55%).
- 2025 YTD ACOS ran roughly 18 to 20% (February 17.48%, March 18.88%, May 18.18%, August 20.10%).
- 2025 Ad ROAS stayed around 5x (January 5.13x, February 5.72x, April 5.45x, May 5.50x, August 4.98x).
Organic share in key windows.
| Month | Total sales | Ad sales | Organic sales | Organic share |
|---|---|---|---|---|
| Nov 2024 | $267,663.00 | $116,170.10 | $151,492.90 | 56.6% |
| Dec 2024 | $259,873.58 | $114,140.82 | $145,732.76 | 56.1% |
| Apr 2025 | $387,625.47 | $163,123.77 | $224,501.70 | 57.9% |
| May 2025 | $402,627.25 | $173,498.35 | $229,128.90 | 56.9% |
We did not trade margin for growth. Ads got cheaper and more productive while organic held or grew in the windows that mattered most, late 2024 and spring 2025.
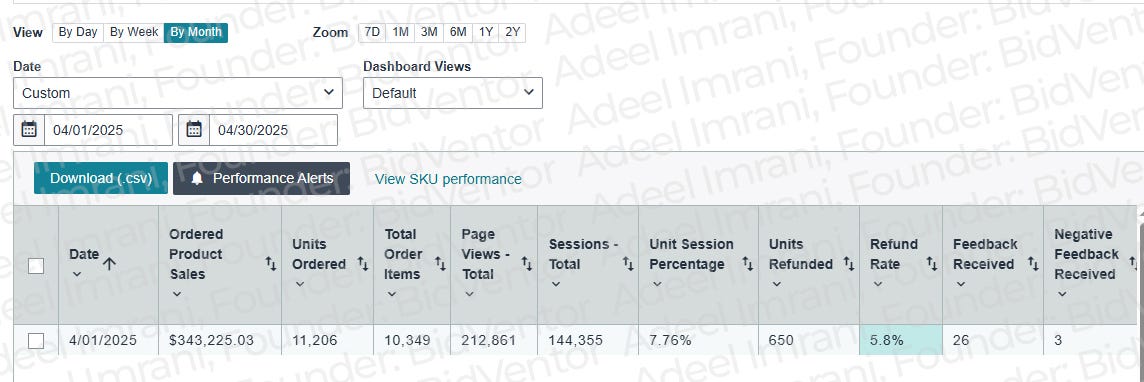
From one hero brand to a portfolio
The biggest structural change was where profit came from. Brand K went from $604K (2023) to $828K (2024) to $454K (2025 YTD). Brand S went from $408K to $522K to $461K over the same periods. By 2025 YTD, Brand S ($460,555.06) and Brand K ($453,783.77) were co-leaders.
The mid-tier brands grew into real contributors (2023, 2024, 2025 YTD):
- Brand M (trend and styling): $49,455.61, $92,093.58, $108,883.51
- Brand F (foot care): $53,155.71, $58,804.88, $69,997.86
- Brand X (skincare): $4,584.21, $10,819.41, $17,048.73
With several engines instead of one, budget could move across tiers like a portfolio manager would move capital, not like a media buyer chasing one hero. In effect, the company became its own Amazon advertising agency.
What we stopped doing
Growth also came from subtraction. A luxury sub-brand, Brand L, went from $42,171.90 (2023) to $30,965.34 (2024) to $14,170.07 (2025 YTD). We did not lose it. We chose to throttle it, because of category fee pressure, weaker replenishment and a lower ceiling. The budget moved to Brands M, X and F, where contribution per click was rising and repeat potential was higher. The mid-tier gains outweighed Brand L’s decline.
The hidden goldmine: the “negative bucket”
Every year the P&L carried a large negative line for returns, refunds, adjustments and reserve mechanics:
- 2023: ($338,537.59)
- 2024: ($450,769.57)
- 2025 YTD: ($297,051.56)
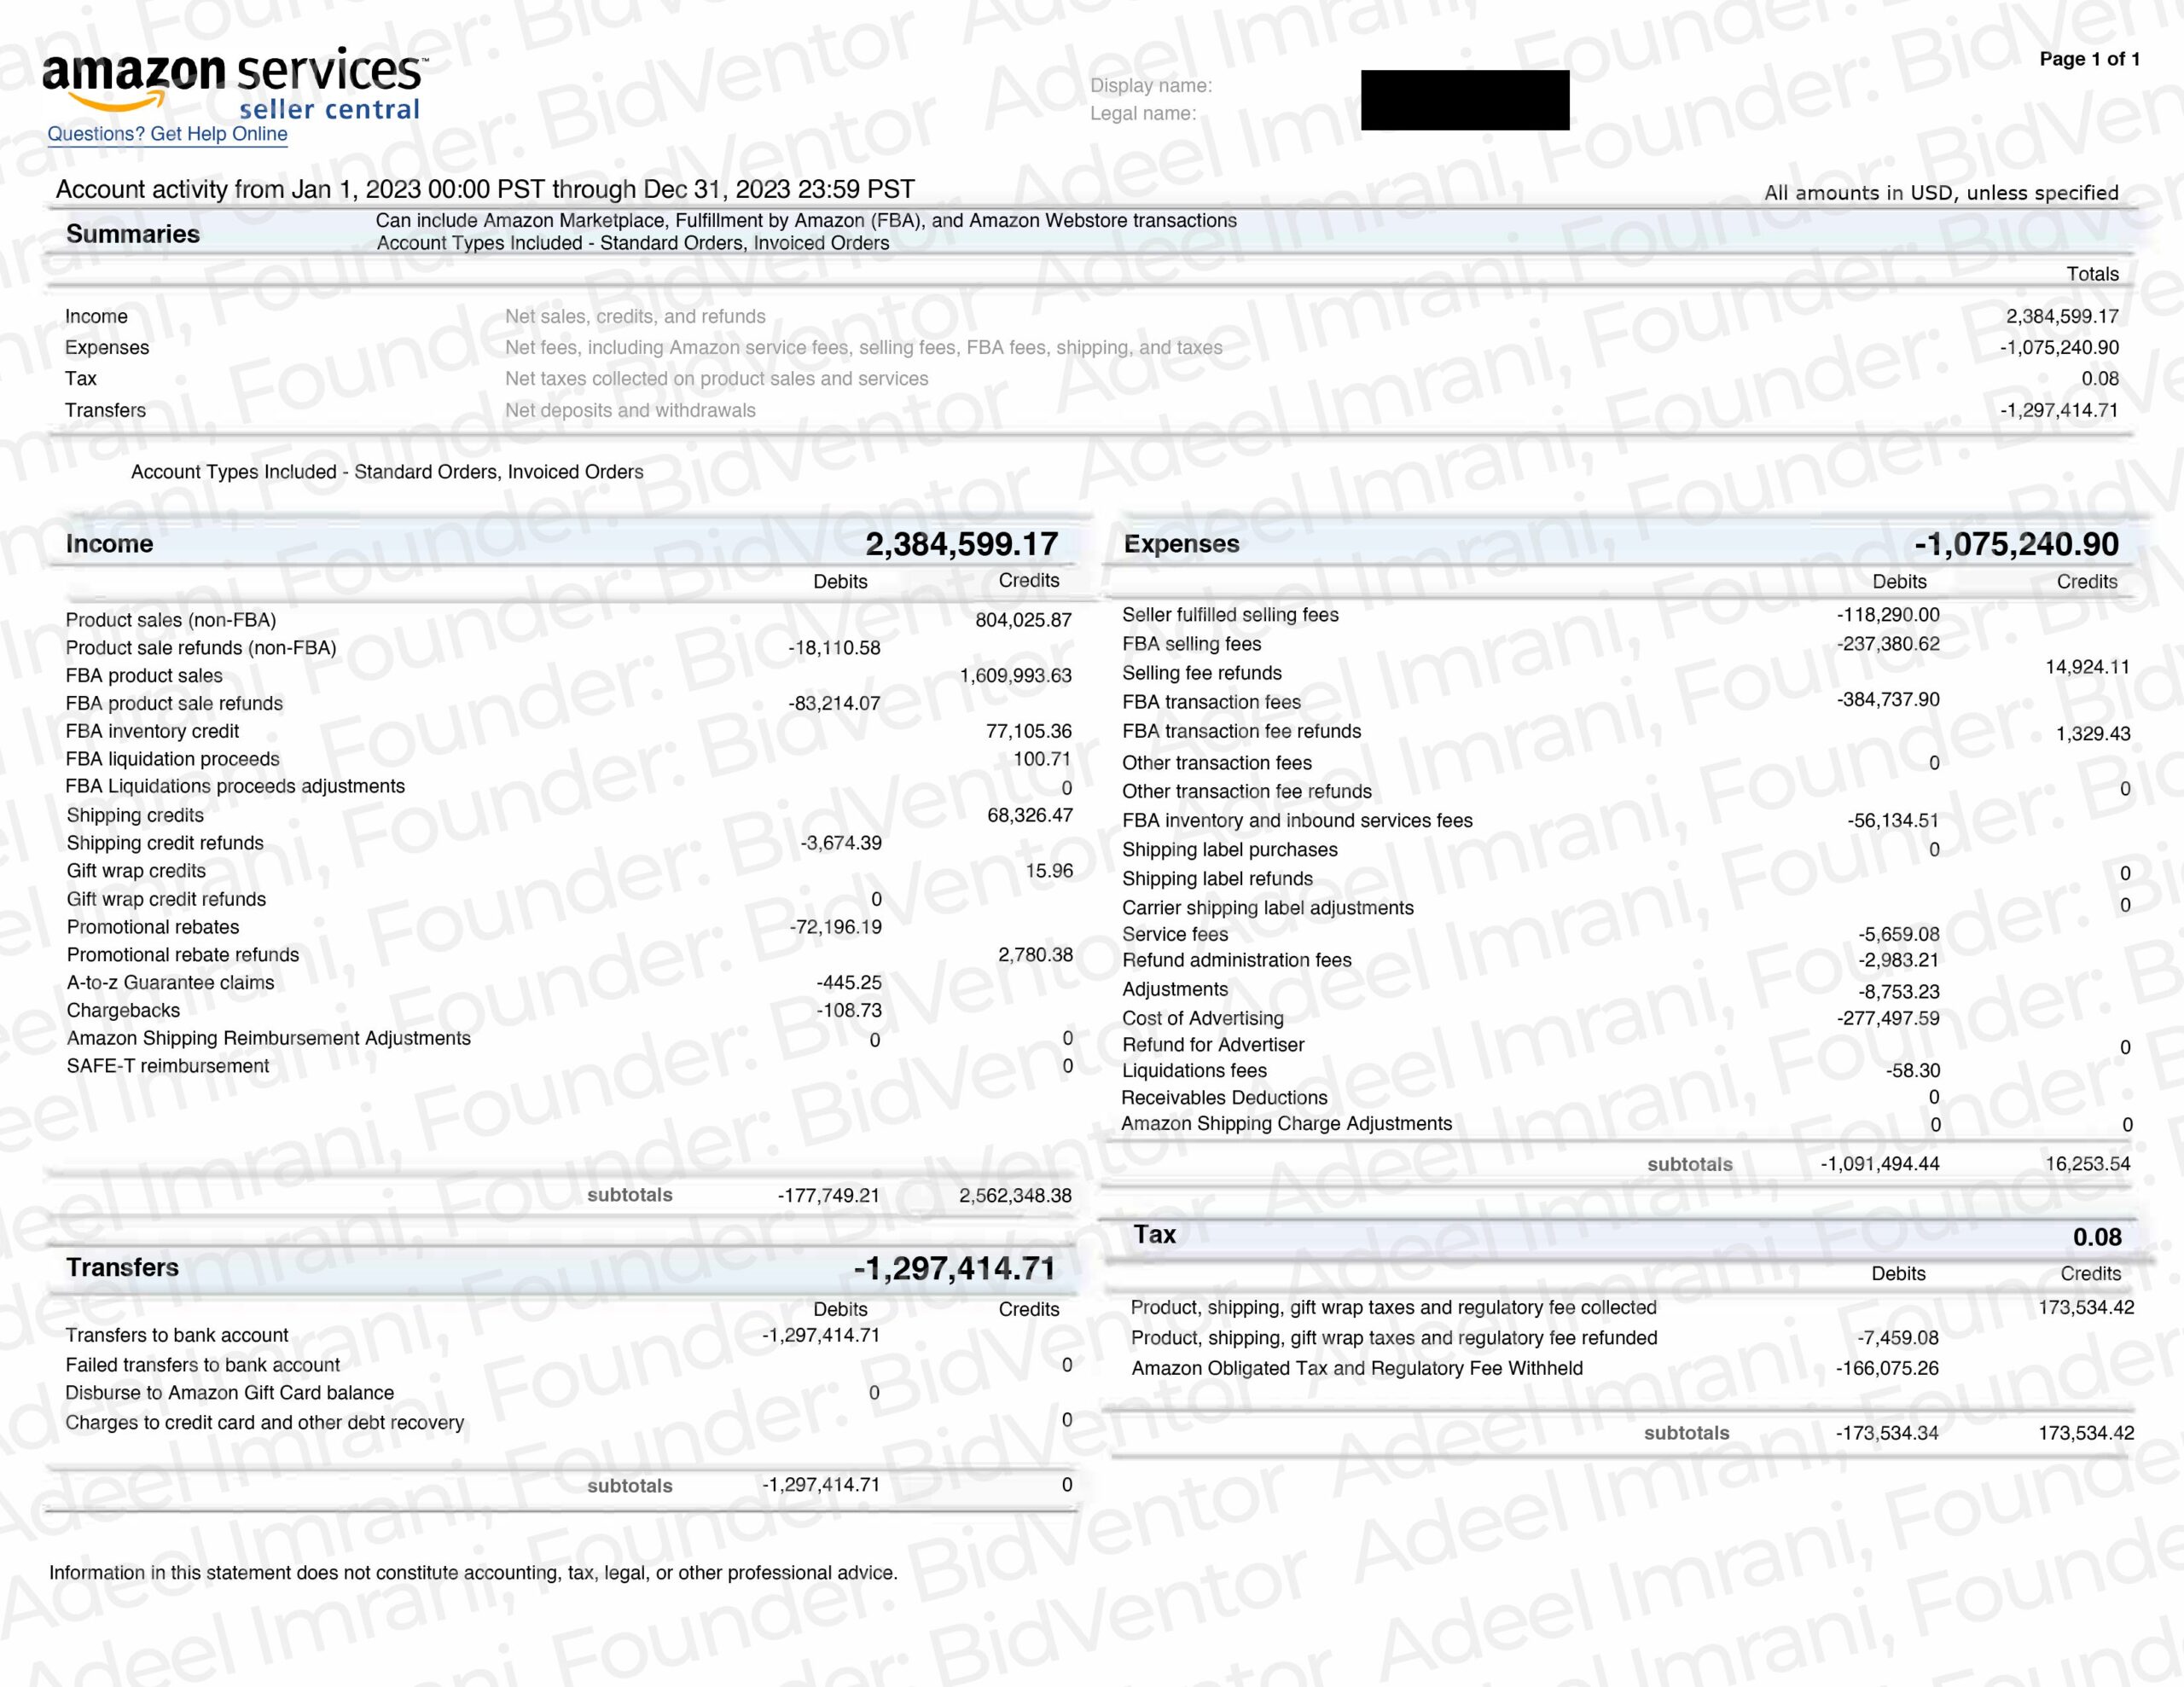
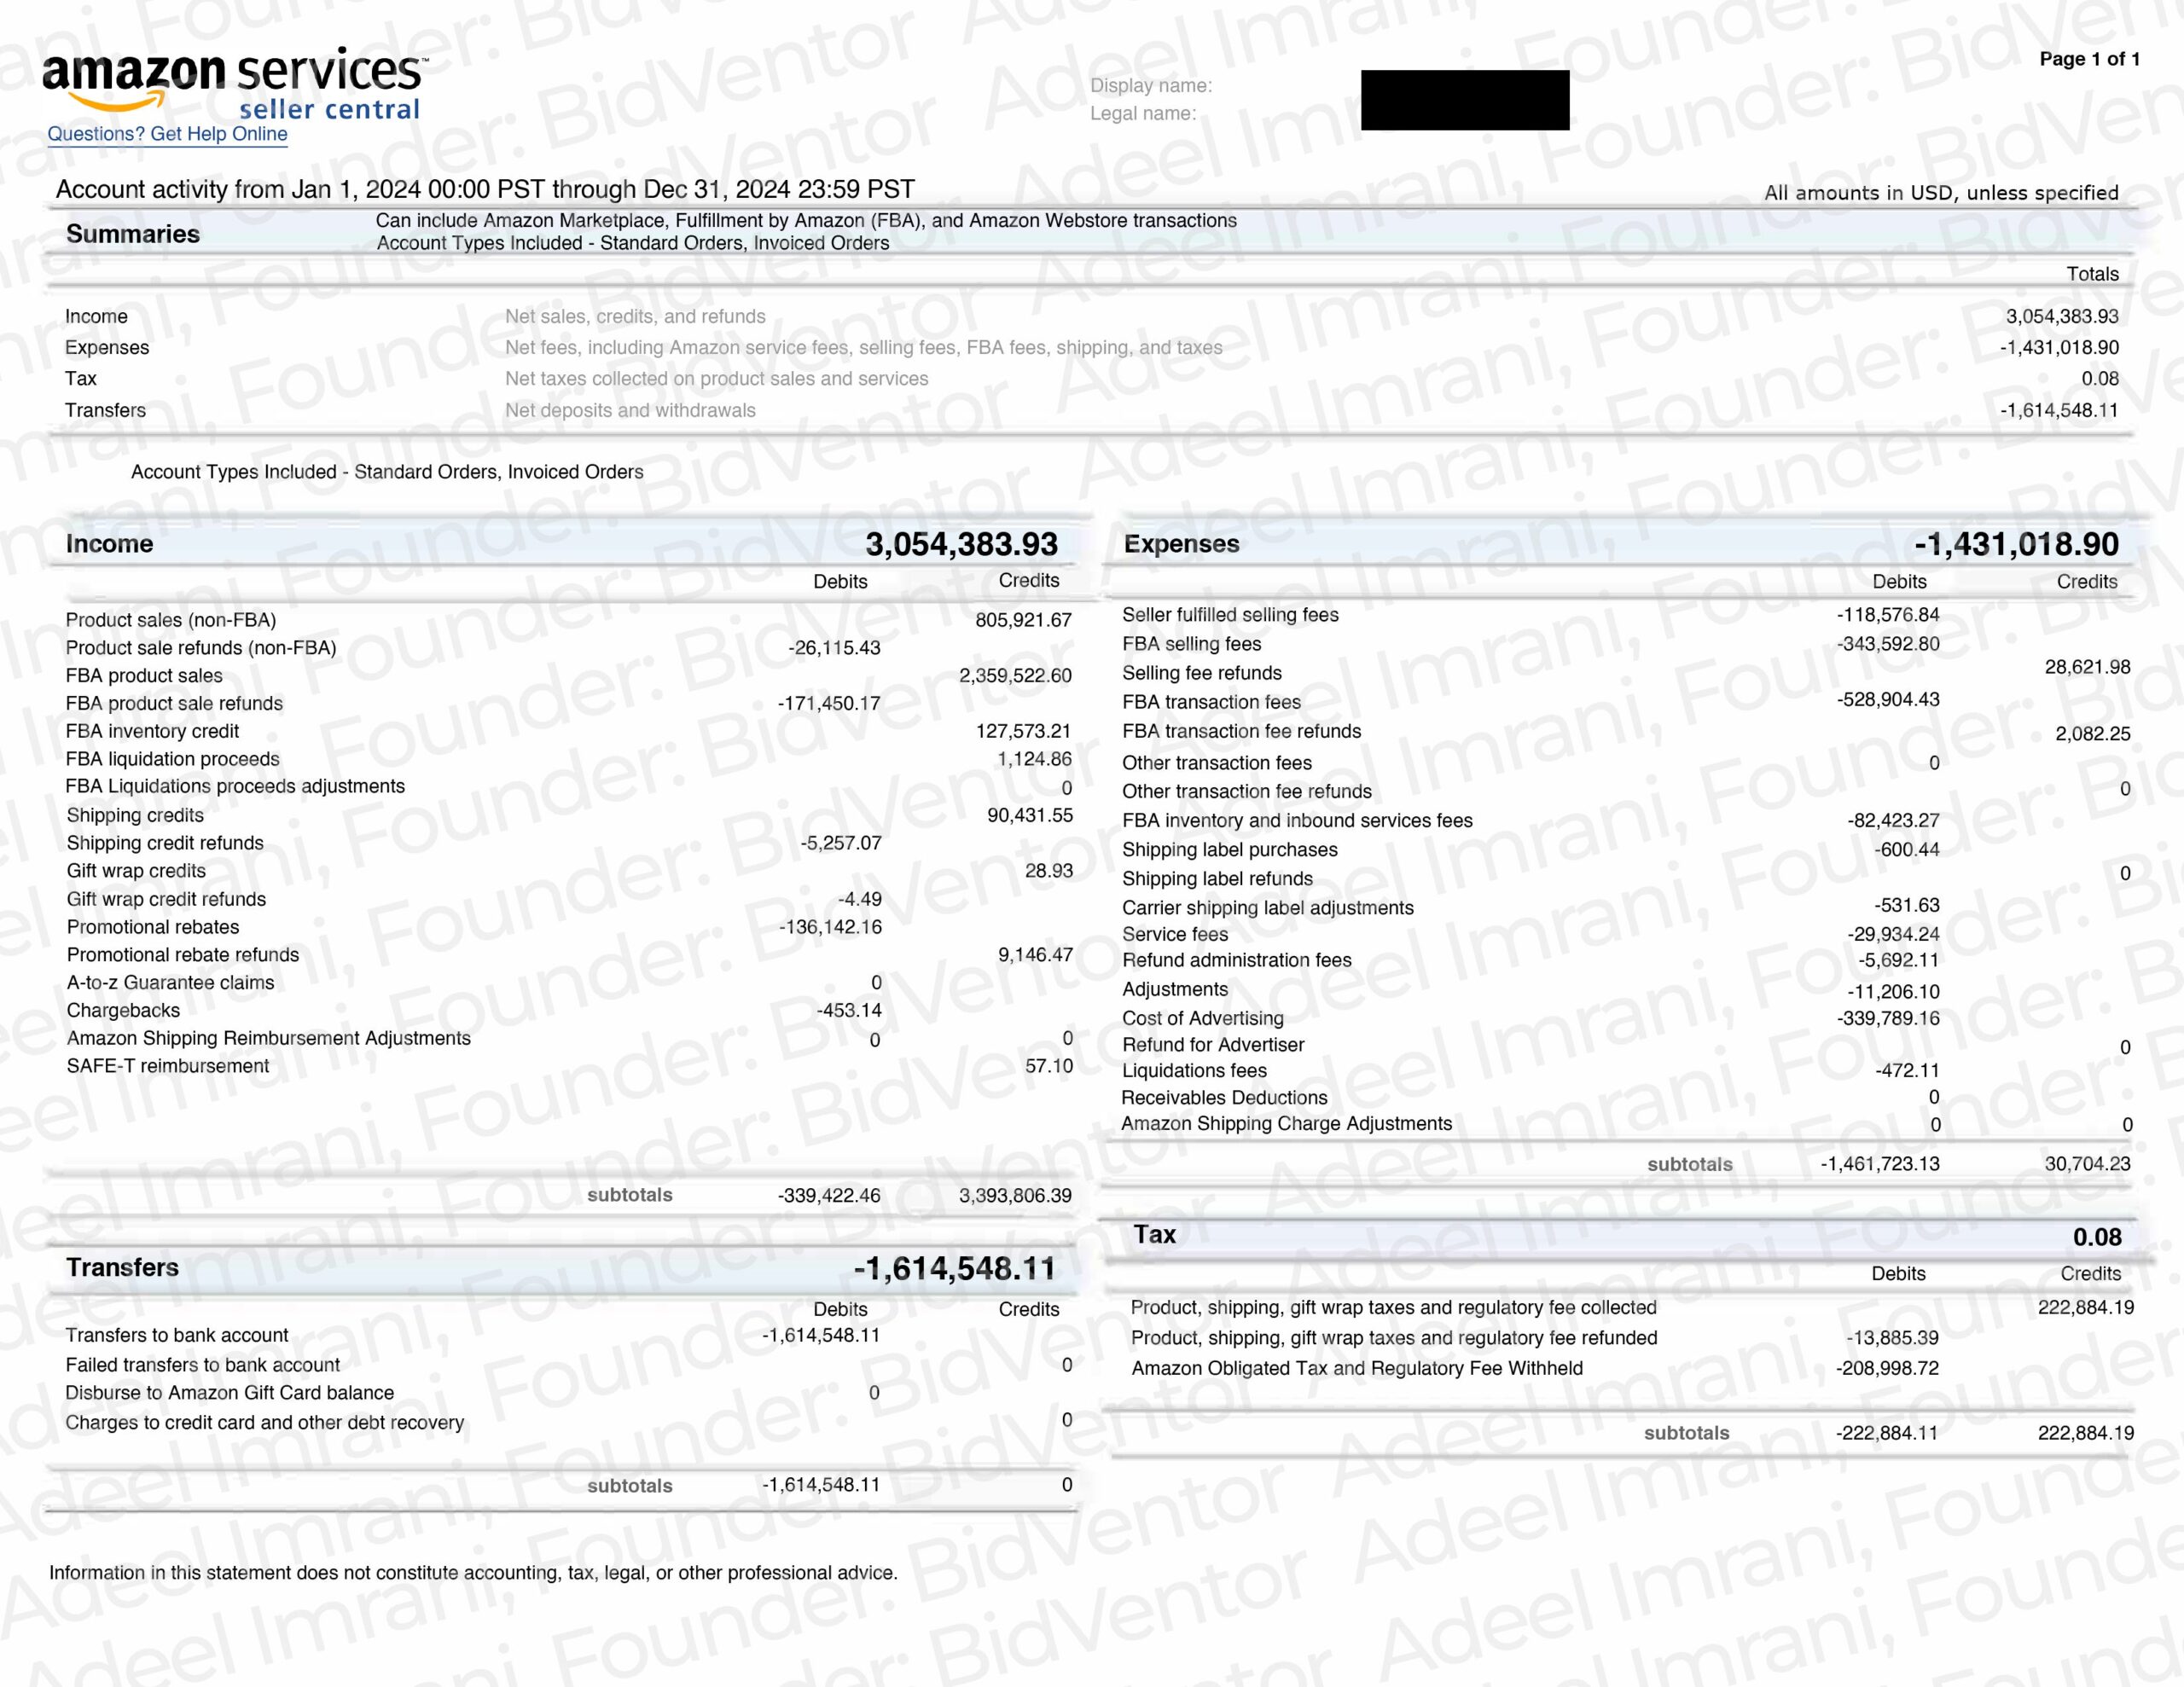
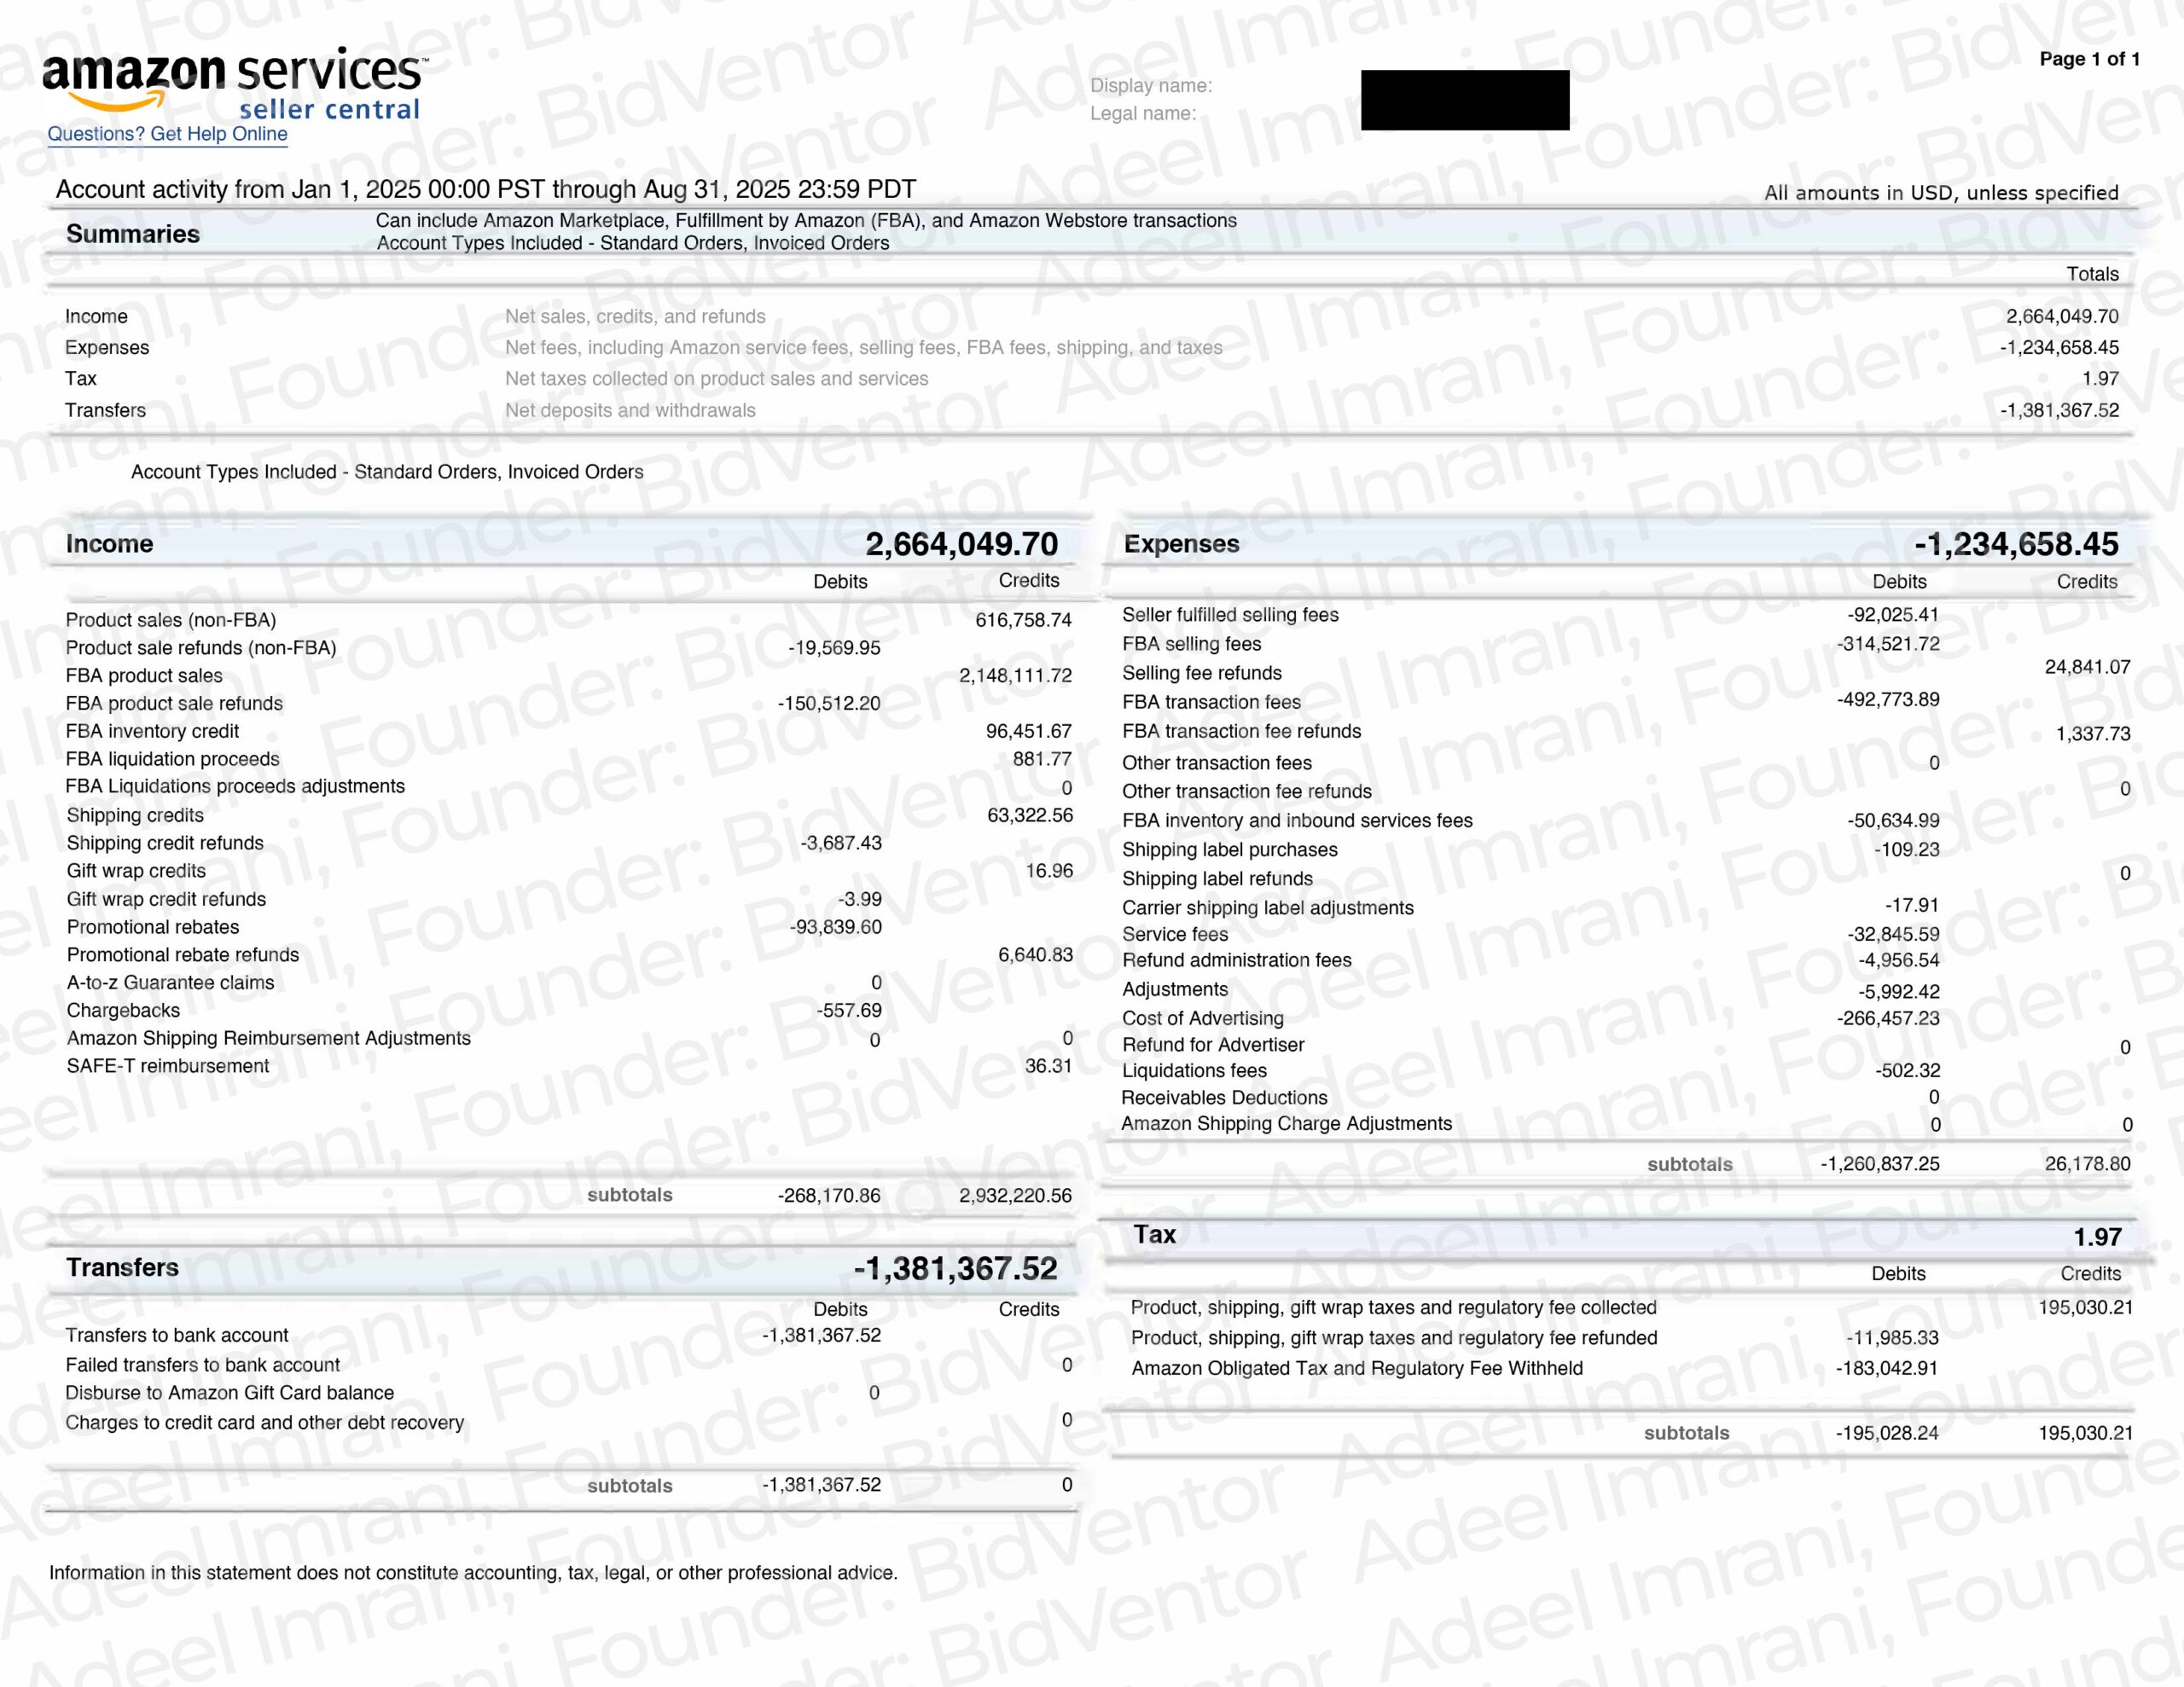
These are the friction costs of selling at volume on Amazon. We treated them like a product to optimize:
- Fewer returns: clearer copy on fit and usage, better “who this is for” targeting, and post-purchase education.
- Packaging QA: fewer damages, so fewer returns.
- Catalog hygiene: suppressing confusing variations.
- Support macros: quick resolution that turns refund requests into exchanges where it makes sense.
Few agencies count this as optimization. At 8-figure scale, it is often six figures of recoverable profit.
Organic momentum, and when it dips
The organic gains were engineered, not lucky. Creative focused on value per ounce, pack-size math and answering objections in the images. Ads were pushed where rank lift was likely and pulled back when returns diminished. Inventory never cut momentum short.
Organic share does dip in heavy demand months. In July and August 2025 it ran about 44 to 45% (July: $351,060.36 total, $195,564.01 ad, $155,496.35 organic, 44.3%; August 44.2%). That was fine, because ACOS stayed efficient (July 19.45%, August 20.10%) and ROAS stayed near 5x. We traded a little organic mix for more profit dollars and rank defense, on purpose. The goal is not the highest organic percentage. The goal is the most profit.
The in-house Amazon PPC playbook you can copy
This is the operating system we ran. None of it depends on an agency.
- Set profit targets first, then back into ACOS. Derive target CPC and target ACOS from SKU-level contribution margin, never the other way round. (Why ACOS is not profit.)
- Ladder campaigns by intent. Defend brand and core terms, harvest close matches and product targets, then expand into category and conquest terms. Demand more from expand spend and protect defend spend ruthlessly.
- Make creative your moat. Sequence images to answer objections, show value per ounce, spell out pack-size math and back it with UGC-style visuals.
- Treat inventory as a marketing lever. If you plan to win rank next month, order for it now. A stockout is a negative ad return in disguise.
- Audit fees every quarter. Small dimensional or packaging changes can move SKUs into a different FBA fee bracket.
- Build for compounding. Do not rely on one hero. Build a two-engine core with mid-tier support, the way Brand K plus Brand S, backed by M, F and X, replaced a one-engine business here.
If you only do five things this quarter:
- Map profit by brand and SKU every quarter. Profit, not revenue.
- Rank your top 20 search terms by contribution, not ACOS.
- List your biggest avoidable costs (fees, damages, returns) and give each one a target and an owner.
- Rewrite your product page to remove the top three reasons people return the product.
- Build a rank plan for the three months before Q4, with inventory ordered to support it.
Do this for 90 days and you will feel what this manufacturer felt: control. Not luck, not hacks, a system.
Where BidVentor fits
I built BidVentor’s Amazon PPC optimization tool around the same profit-first thinking. BidVentor is a verified Amazon Ads partner, so you can connect your Amazon Ads account through the Amazon Ads API (bulk files work too). It flags wasted spend, weak bids and missing negatives, and shows the reasoning so your team can make the call, whether you run PPC in-house or still work with an agency. The PPC tool comes with a 4X ROAS guarantee that applies to PPC only, and terms apply. It is free to scan, with paid plans; see pricing.
The other half of this story was listings: copy and images that answer objections and cut returns. That is where the free scan starts. Run a free Lost Sales Scan to see what your buyers’ reviews say your listing is missing.
Frequently Asked Questions
Did the ads get cheaper, or did the brand just spend less?
Both efficiency and control improved. 2025 YTD ACOS sat near 18 to 20% (February 17.48%, May 18.18%, August 20.10%), Ad ROAS stayed near 5x, and total sales were well above 2023.
Did organic sales actually improve or just hold?
They improved in key windows. Organic share was about 56% in Q4 2024 and about 57 to 58% in April and May 2025. It dipped into the mid-40s in the heavy demand months of July and August 2025, by choice, to defend and extend rank.
Was the diversification real, or was it still mostly Brand K?
It was real. In 2023, Brand K was 66.3% of branded profit. In 2025 YTD, Brand S ($460,555.06) and Brand K ($453,783.77) were co-leaders, and Brands M, F and X were all well above their 2023 profit.
Is in-house Amazon PPC right for every brand?
Not always. In-house works best when someone owns profit across ads, listings, inventory and fees, as in this case. If you do not have that person yet, compare your options in Amazon ads agency vs automation before you decide.
What should I do first if I am thinking of firing my agency?
Map profit by brand and SKU, find your Brand K, and rank your top search terms by contribution instead of ACOS. That shows you quickly whether your agency is building profit or just spend.
Related guides
- Amazon ads agency vs automation in 2026: do you still need one?
- Amazon ACOS optimization: why ACOS does not equal profit
- TACoS vs ACoS: the hidden metric killing Amazon PPC profits
- Amazon CPC: how to work out the most you can afford per click
About the author
Adeel Imrani is the founder of BidVentor. He has 14 years of experience selling on Amazon, has managed $30M+ in ad spend, and has worked across 12+ brands and 500+ products. Read more on his author page.
Ready to Optimize Your Amazon PPC?
Connect your Amazon Ads account or bring a bulk file. BidVentor is Amazon bid optimization software that reviews weak bids, wasted spend, and negative-keyword gaps. The PPC tool includes a 4X ROAS guarantee. Terms apply.
About BidVentor Editorial Team
The BidVentor Editorial Team is a dedicated collective of Amazon PPC and paid advertising experts. We empower brands to unlock scalable growth through data-driven strategies, precision campaign management, and a relentless focus on ROI. Our mission is to transform your ad spend into your most profitable channel.